When you are working on a B2B software of any kind, the new features are not the only ones that matter. Statistics of both user engagement and performance are vital for your business success as well. SaaS metrics visualization can help you achieve that. Most SaaS metrics are used for measuring the efficiency of your business. It means that you gain more insights into the core reasons for your product’s downfall or progress. Therefore, visualizing SaaS Metrics gives the opportunity to understand your SaaS business’ patterns better and perceive trends faster. So, it’s a crucial step if you want to succeed in the B2B software industry.
What is SaaS metrics visualization
Without any doubt, you’ve tried to analyze groups of information collected in a specific field before. An example is pulling insights from your business’ churn rate. And you may have realized the difficulty of interpreting data presented in complex statistics and intertwined columns and rows. Well, fortunately there’s a better way for displaying data so that it’d be easier to identify and analyze. And that’s visualization. SaaS metrics visualization is the attempt to picture a graphical image of gathered information (related to one or more SaaS metrics) by visual elements.
Why is SaaS metrics visualization important?
Gone are the days when you had to spend hours on data report sheets to figure out the relationship between numbers and connecting a bunch of idioms. The former solutions are outdated these days.
Today with the mass data bombardment, International remote employees (which’s common in SaaS businesses), and many other reasons, things have changed. Simplicity is one of the keywords of our time. As companies now try to design a simplified product for their consumers (especially SaaS companies). However, other than simplicity, and universal Perceptibility, visualizing assessment metrics in SaaS companies has additional benefits:
1. You have transparent data at your disposal
When you or your team members are using non-visual SaaS metrics, you may lose some details in your interpreting path. Usually, it happens because there’s a vast volume of data, and missing some of them is very likely. On the flip side, visualizing spreads transparency as that amount of data is provided at first glance. So, all the ones who should understand the information can access it directly and clearly.
2. You can better understand your customers’ needs
As the SaaS product owner, you should always be concerned about your customer’s satisfaction, but it’s hard to do without information. Visualized data gives you a holistic picture of your customer’s behavior with your SaaS solution. An illustration that you can comprehend easily. And by understanding how they use your product, their problems, and preferences, you can provide them with valuable services customized for their needs. Besides, it means that your clients will be even more satisfied with your work. Visualization helps you in analyzing customer’s feedback data in less than a minute. Best way to understand customer needs is by getting feedback from surveys using different Likert scales.
3. You can compare the results of different months or years
Comparing data, you can see how both you and your company are changing. If there are any improvements, you’ll spot them right away by comparing different months or years’ performances of your business activities. And upon the results, you can adjust your work accordingly. Also, data techniques such as the data flow diagram can help you to accomplish that. A reliable tool that we recommend here which gives you a hand to create one is the Sankey diagram generator.
4. You know better what you should do next in different scenarios
SaaS Companies often use illustrated metrics to gain information on crucial figures related to the B2B software market. Visualizing your SaaS metrics delivers an insight into how people use your software and what results they get. Using these insights lets you compare the outcomes of applying different features. Also, it helps you determine which way to go in the future by choosing what to improve.
What SaaS metrics you may visualize
In other words, which types of information do you need to gather and visualize? There are some metrics in particular for subscription-based businesses. Here we introduce the most important ones:
Revenue
Revenue is one of the main things SaaS companies use to calculate their ROI (return on investment). It also allows managers to assess how well they are doing in terms of pricing and make changes, if necessary.
Customer Acquisition Cost (CAC)
Customer acquisition cost (CAC) provides information about how much money you spend on attracting new customers. It also illustrates your marketing expenses and helps improve how you attract new users in the B2B industry.
Churn or Churn Rate
Churn, or churn rate, is another SaaS metric that will help you understand what causes people to stop using your product. It shows how many people leave you and prompts you to think about ways to reduce this number.
MRR (Monthly Recurring Revenue)
MRR is an essential indicator that reflects revenue coming from your customers every month. Usually, it is calculated as the difference between total revenue and Churned Customers. But, MRR also includes two other elements, Upsells and Expansion MRR. Upsells are new purchases from existing customers. And Expansion MRR is a result of additional services that clients buy.
User/Company Engagement
User engagement shows how users use your product and what they get out of it. You can discover their behavior by visualizing User Engagement metrics and by looking at features they use most frequently. It means that you can adjust the way your product works to meet users’ preferences and make them satisfied with what they get.
Customer Satisfaction (CSAT)
Customer Satisfaction (CSAT) represents the general perception of your clients about provided services. SaaS marketers usually measure it by Net Promoter Score (NPS). NPS is a metric derived from customers’ responses. For instance, if you receive positive feedback from your customers ready to recommend your product or service, these people will answer 9 or 10 on a scale from 0 to 10. If you receive neutral feedback, they’ll choose an intermediate point, e.g, 8. But if your customers aren’t satisfied with what they get, They’ll answer 7 or below.
Monthly Active Users (MAU)
Monthly Active Users (MAU) show how many customers are using your SaaS. Based on this indicator, you can compare the number of active users in different periods. Also, it makes goal-setting easier for future growth.
Daily Active Users (DAU)
Daily Active Users (DAU) indicate how many users log into your SaaS website daily. They are calculated by dividing MAU by 30 days. So you get the average number of consumers using your software daily. You may compare different periods or set goals for future growth by looking at this metric.
Average Revenue per User (ARPU)
Average Revenue per User (ARPU) shows how much money you make from each user every month. And it’s calculated by dividing Monthly Recurring Revenue by MAU.
Customer Lifetime Value (CLV)
Customer Lifetime Value shows the amount of revenue a typical customer brings in during his/her connection period with your SaaS company. It’s essential to measure your company’s CLV rate because it represents brand loyalty and the potential growth of your business. Here’s the formula for calculating: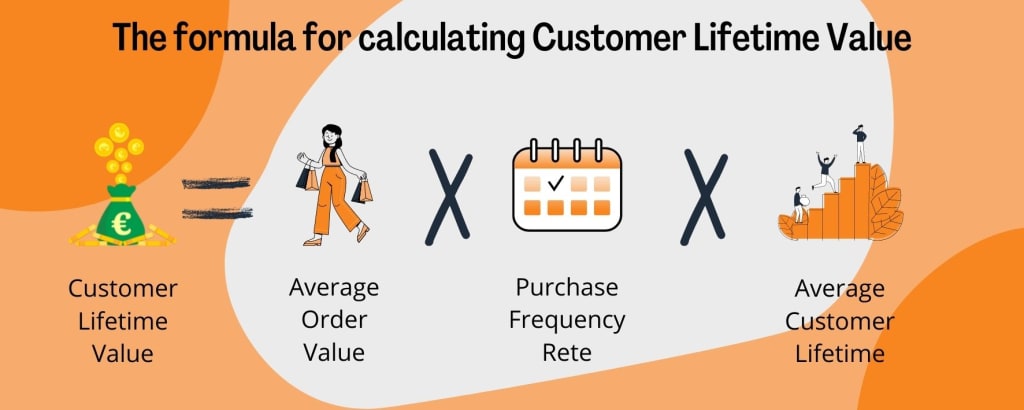
Conclusion
Visualizing SaaS metrics is crucial for understanding your business activity and spotting problematic areas where you need to improve. It enables you to better reach out to customers and offer them valuable services that answer their needs effectively. Data visualization techniques can help you become more resourceful and up-to-date with what is going on in your business. Therefore, you should use different techniques to fully comprehend what SaaS metrics matter to your business.


Comments